EnviroCar Service
Additional encodings for tracks
Track resources are available encoded as zipped shapefile and as comma-separated-values (CSV). To request the content in either of the formats you have to (a) set the appropriate Accept header, or (b) use the "file extension" in the URL.
Shapefile
Note that the shapefile export currently is limited to tracks consisting of less than 500 measurements. If you want to export larger tracks, please contact us or visit the enviroCar forum.
To get a track as zipped shapefile:
curl -H "Accept: application/x-zipped-shp" https://envirocar.org/api/stable/tracks/53433169e4b09d7b34fa824a > /tmp/track.zip
or
curl https://envirocar.org/api/stable/tracks/53433169e4b09d7b34fa824a.shp > /tmp/track.zip
After unzipping, six files should be present, e.g.:
shp3639973723505543106.dbf
shp3639973723505543106.fix
shp3639973723505543106.prj
shp3639973723505543106.qix
shp3639973723505543106.shp
shp3639973723505543106.shx
Adding enviroCar shapefiles to GIS
You can now add the shapefile to your favorite GIS, e.g. ArcMap:
ArcMap
Click on the "Add data" button:
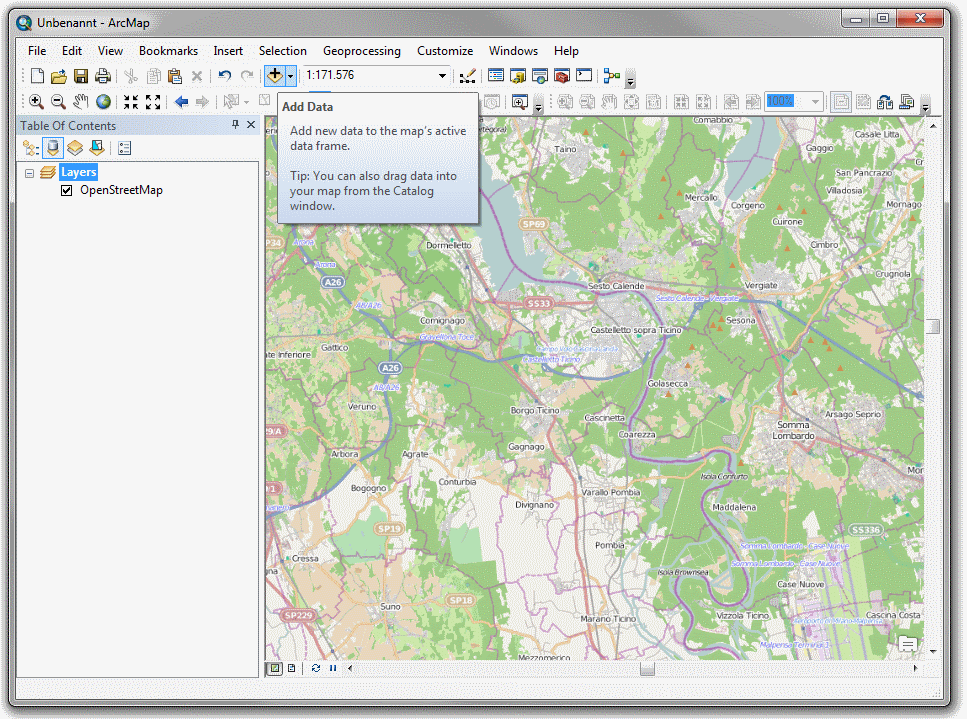
Select the downloaded shapefile and add it to the map:
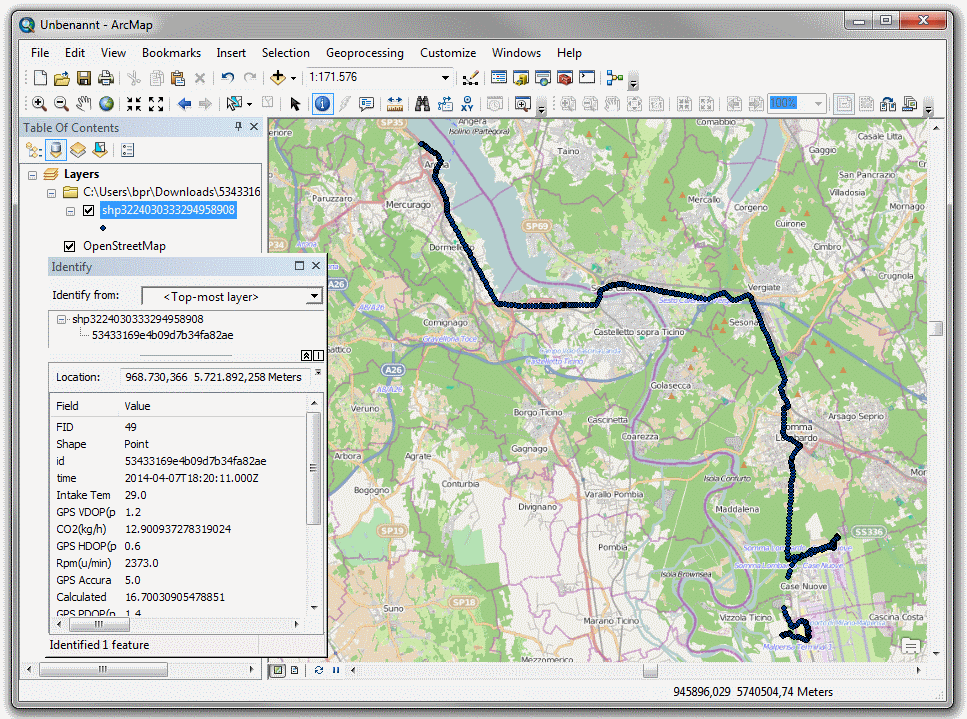
Note that the phenomenon names are truncated as the shapefile specification only allows ten characters for field names.
Other GIS
- Quantum GIS: See the QGSI tutorial Working with vector data: ESRI Shapefiles
- GRASS GIS: See GRASS Wiki on Importing data
- gvSIG: See first part of the video Vector reprojection on gvSIG
CSV
To get a track as CSV:
curl -H "Accept: text/csv" https://envirocar.org/api/stable/tracks/537ed45be4b008867f814d48 > /tmp/track.txt
or
curl https://envirocar.org/api/stable/tracks/537ed45be4b008867f814d48.csv > /tmp/track.txt
Excerpt from the CSV file:
id; Intake Temperature(c); O2 Lambda Voltage ER(ratio); Throttle Position(%); GPS VDOP(precision); Long-Term Fuel Trim 1(%); CO2(kg/h); O2 Lambda Voltage(V); MAF(l/s); GPS HDOP(precision); Rpm(u/min); GPS Accuracy(%); GPS PDOP(precision); Short-Term Fuel Trim 1(%); GPS Altitude(m); GPS Speed(km/h); Engine Load(%); Consumption(l/h); GPS Bearing(deg); Speed(km/h); longitude; latitude; time
537ed45be4b008867f814d4a; 10.0; 1.025390625; 17.0; 1.3; 4.6875; 10.876756549746904; 1.5625; 14.079999923706055; 0.8; 3062.0; 5.0; 1.5; 0.78125; 465.6; 99.9; 47.05882263183594; 4.628407042445491; 232.63999938964844; 99.0; 11.819821055978537; 48.718987656757236; 2014-04-28T20:43:55Z
537ed45be4b008867f814d4c; 10.0; 0.9970703125; 21.0; 1.3; 4.6875; 19.026598447709034; 1.494140625; 24.6299991607666; 0.8; 3236.0; 5.0; 1.5; 1.5625; 463.4; 106.425; 64.31372833251953; 8.096424871365546; 232.47000122070312; 103.0; 11.817952897399664; 48.71804649475962; 2014-04-28T20:44:01Z
537ed45be4b008867f814d4e; 10.0; 0.99609375; 18.0; 1.3; 5.46875; 14.553842057334023; 1.4892578125; 18.84000015258789; 0.8; 3330.0; 5.0; 1.5; -5.46875; 461.1; 106.65; 50.19607925415039; 6.1931242797166055; 231.9499969482422; 107.0; 11.816021371632814; 48.71706790756434; 2014-04-28T20:44:07Z
537ed45be4b008867f814d50; 10.0; 0.9794921875; 16.0; 1.9; 4.6875; 12.599424323779624; 1.40625; 16.309999465942383; 1.0; 3276.0; 5.0; 2.2; 0.0; 458.29999999999995; 106.65; 42.35293960571289; 5.361457159055159; 231.50999450683594; 105.0; 11.814125720411539; 48.71608894318342; 2014-04-28T20:44:13Z
537ed45be4b008867f814d52; 10.0; 0.9931640625; 10.0; 1.9; 5.46875; 11.00035593879009; 1.484375; 14.239999771118164; 1.0; 3344.0; 5.0; 2.2; -3.125; 455.5; 107.10000000000001; 28.235294342041016; 4.681002527144719; 233.7899932861328; 108.0; 11.812202744185925; 48.71509606484324; 2014-04-28T20:44:19Z
537ed45be4b008867f814d54; 10.0; 1.00390625; 10.0; 1.3; 5.46875; 6.890672569551822; 1.4990234375; 8.920000076293945; 0.8; 3295.0; 5.0; 1.5; -0.78125; 452.1; 103.95; 21.960784912109375; 2.932201093426307; 242.67999267578125; 106.0; 11.810170216485858; 48.714268896728754; 2014-04-28T20:44:25Z
537ed45be4b008867f814d56; 10.0; 0.990234375; 10.0; 1.3; 5.46875; 6.4426244159150405; 1.4453125; 8.34000015258789; 0.8; 3185.0; 5.0; 1.5; 1.5625; 449.0; 101.025; 25.098039627075195; 2.741542304644698; 252.63999938964844; 103.0; 11.808027885854244; 48.71370056178421; 2014-04-28T20:44:31Z
537ed45be4b008867f814d58; 10.0; 0.990234375; 20.0; 1.3; 4.6875; 11.77285285702047; 1.46484375; 15.239999771118164; 0.6; 3116.0; 5.0; 1.5; -0.78125; 447.9; 100.125; 61.17647171020508; 5.00972462000871; 261.1600036621094; 100.0; 11.805808106437325; 48.713379870168865; 2014-04-28T20:44:38Z
...
The features encoded as CSV can also be added to most GIS or used in scripting languages.
Importing enviroCar CSV files
Quantum GIS
Click Layer -> Add Delimited Text Layers...:
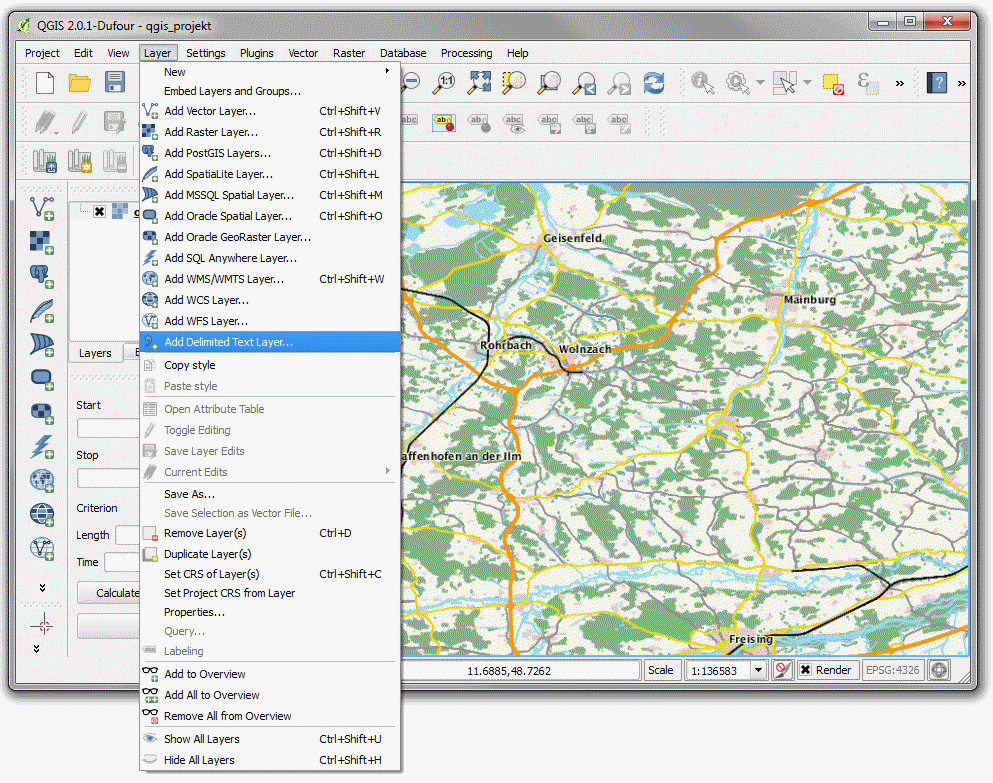
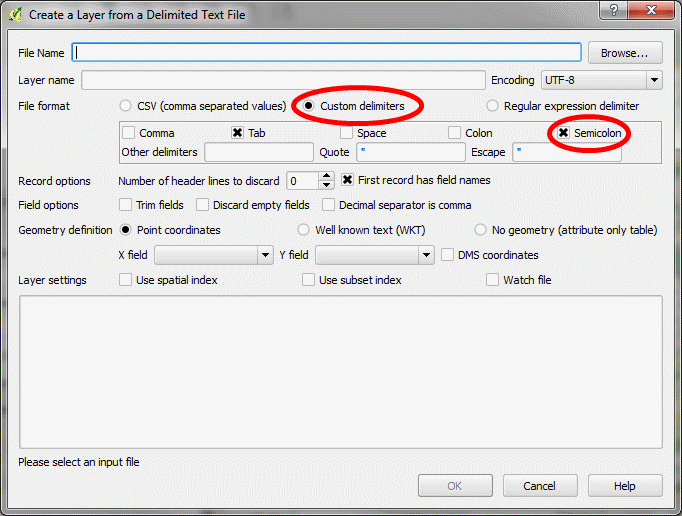
In the dialog select Custom delimiters and check Semicolon:
Browse to the CSV file and open it:
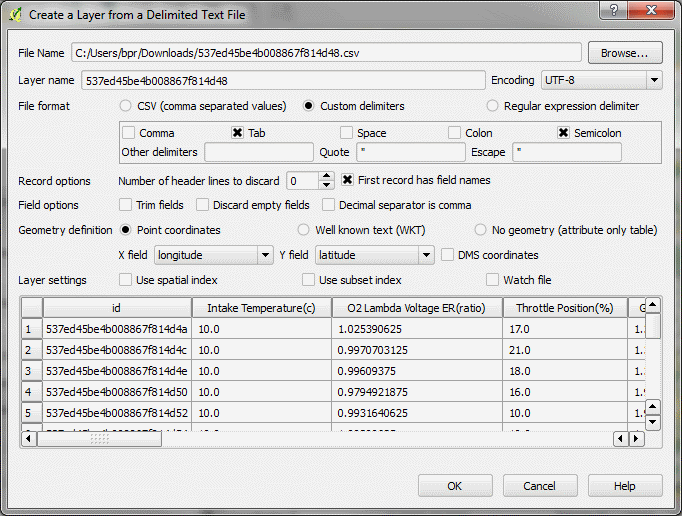
The columns, including the ones holding the coordinates (longitude, latitude), should be automatically resolved. If not, please use the setting shown above.
Click ok, you will be prompted to chose a CRS:
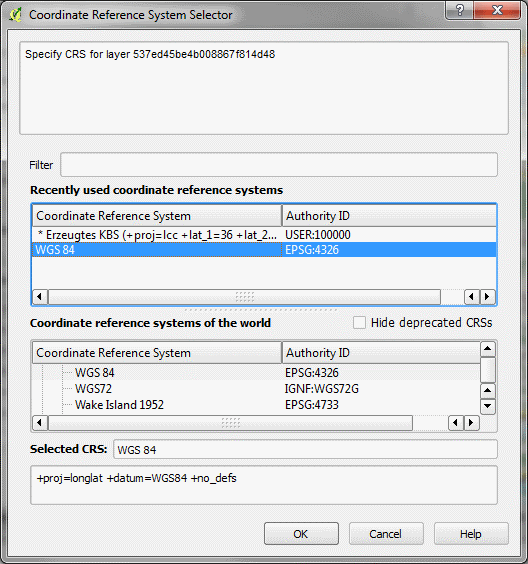
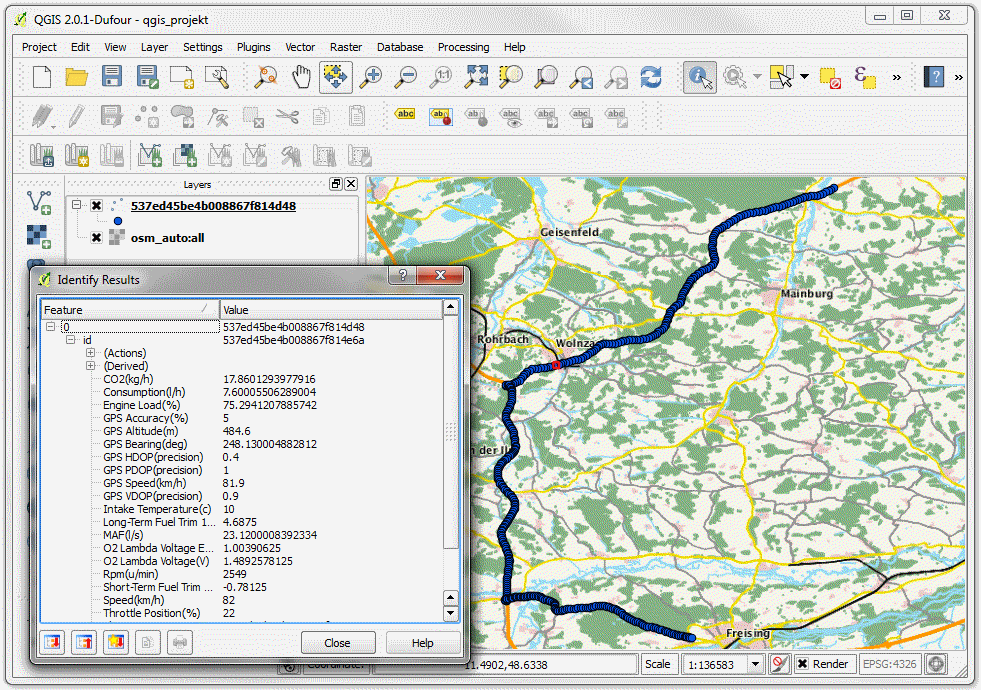
Choose WGS84 and click ok, the layer will be added:
R
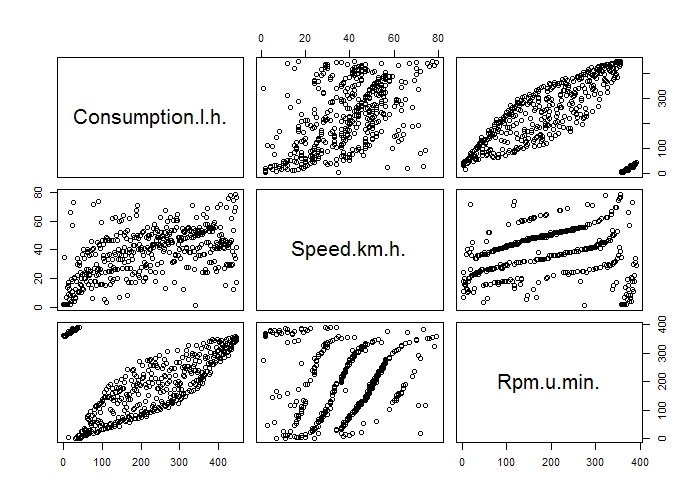
In the R environment for statistics computing and graphics, see (http://www.r-project.org/), the following two lines suffice to download and import enviroCar CSV data and display a plot which contrasts selected measurement variables.
track = read.csv2("https://envirocar.org/api/stable/tracks/53433169e4b09d7b34fa824a.csv")
plot(subset(track, select = c("Consumption.l.h.", "Speed.km.h.", "Rpm.u.min.")))
The created plot:
